At last, a project management template which is really easy to use and looks pretty.
What it is, and who it is for
Most project management software packages are too complex for the average person managing a medium complexity project. As a result, project managers tend to create their own plans in Excel to allow them to achieve what they want. This is fine, but these plans often look unprofessional, or take a long time to create.
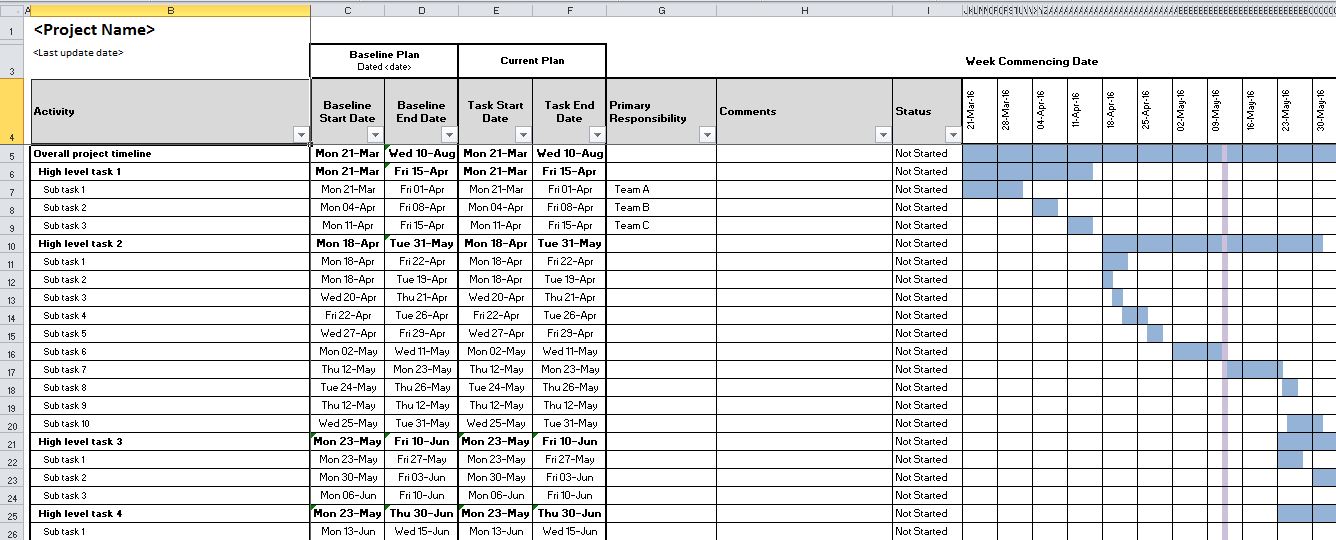
Therefore we created a ‘best practice’ project management template which automatically creates a pretty GANTT chart for you. It is totally free to download and you can customise it to your needs.
We hope you enjoy using it. Please remember to comment in the box below if you like it, or can think of ways to make it better.
Here’s how to use it:
- Download it using the button at the top of the page, then save it locally on your computer.
- Edit your project name in cell B1
- Add the date on which this plan is valid into cell B3. It’s always useful to date a project plan so people know whether any recent events have been accounted for in the plan yet or not. Ideally project plans should be updated daily even if it is to confirm everything is still valid. In this case you should still update the date to show that the plan was valid on this date.
- Add your tasks and sub tasks in column B. You should format the tasks by making them bold and the sub tasks by indenting them.
- Now you need some baseline dates into columns C and D. These are the dates that your initial plan stated you would complete each task. If you are creating your plan for the first time then you can put the same dates into columns E and F respectively. As you review and revise the plan on a daily basis the dates in columns E and F may change, but the baseline dates should remain static unless you have agreed to re-baseline the plan with project sponsors. Whenever you baseline the dates of your plan, make sure you reference this date for clarity in cell C3.
- In column G add who is responsible for each task. You should put just one name in each row. If there are multiple people responsible for this task then create individual line items for each responsible person.
- Add any comments in column H. You may not have comments on day 1, but as you progress the project this will be useful to add additional information for each task or subtask.
- Finally set the status of each task or subtask. There are 5 types of status to use
- Not started – for any tasks which you have not yet started work on
- On track – for tasks that you have started and are still on track to complete by the baseline end date
- On hold – for tasks which you have decided to postpone until a later time
- Delayed – for tasks which are not on track to complete on the baseline end date or before
- Complete – for completed tasks
- For tasks with subtasks you may prefer to create formulas to calculate the correct dates based on the subtasks. In the screenshot below I have used the =MIN( ) formula to find the minimum date between cells C26 and C33. This is therefore the start date of the task, likewise I used the =MAX( ) formula to find the maximum date between cells D26 and D33 for the task end date. You can add these dates manually if you prefer, or even leave out dates for tasks with subtasks.
- The final step is to admire the beautiful GANTT chart which is created for you.
- Today is coloured yellow to remind you where we are currently on the plan
- The GANTT is coloured blue to show where we are on track according to the baseline plan
- Any tasks or subtasks which are planned to start or finish early will be coloured green
- Any tasks or subtasks which are now planned to start or finish late will be coloured red

If you haven’t already, please go and download it using the button below:
We hope you enjoy this free template. If you have any questions or requests for enhancements, please leave them in the comments box below so we can answer them for everyone to see.
Enjoy
Video guide
If you’re still not clear on how to use the template, here is a video which steps through how to use it to create a project plan:
18 Responses
Is it possible to change the document from tracking weekly to tracking twice a month, or monthly?
Please can you explain what you mean?
Hi there. I’m not quite sure what you mean by this? Can you clarity please? The GANTT chart shows daily data but you can update the dates as often as you like.
How do I add data in the “Primary Responsibility” dropdown like you did with “Status”
Hi Mercy, you can add a dropdown by using ‘Data Validation’ and ticking the in-cell dropdown box. A guide to data validation can be found here – https://support.office.com/en-gb/article/Apply-data-validation-to-cells-29fecbcc-d1b9-42c1-9d76-eff3ce5f7249
Hi what is the password for this sheet
Hi Amit, you should not need a password.
If you want to add an extra worksheet, you are not able to as the file is Protected and needs a password
ithttps://uploads.disquscdn.com/images/f8eeaac8f94a0a6a52ff42075a3992d96c5308345a50a7919b72767c122545aa.jpg
I want to delete a sheet but i cannot since it says it is password protected… what to do?
How do I change the week commencing dates to 2017/2018?
Hi Matthew, the dates used by the GANTT chart are dependent on the dates you enter in columns C to F. The earliest date from C-F will be the starting date in the week commencing dates.
Hi Philip, quick question, when I change the dates in C-F it doesn’t reset the date headers from J onwards. The first date is set at 28 Mar 16, but I need to reset to 1 Jan 18. Please can you help? Many thanks Gez
Hi Gez, the date headers in the GANTT chart from column J onward are dependent on the dates in C-F. The first date shown in column J will be the Monday of the week which includes the first date given in columns C-F. If the date in column J isn’t updating, it may be because you haven’t edited all of the dates in columns C-F, and the earliest date is still there somewhere.
Hi if i have to add some sub task under a high level task then how do i manage the formulas, which all formulas i would have to change.
From the screenshot above it looks like you sorted this out already 🙂
https://uploads.disquscdn.com/images/5bcf0fec55e569210b64c8d2d5112629ec65a62029316c3c28523786d33a3b3b.png
Hi i had inserted one row under high level task 1. and change the min max formula where i included the added row. then why the dates are shown in green. ? Please view the attached sheet you will understand it better what i am asking for?
Hi Gargi, you need to add your current plan dates too. This is why the GANTT chart is highlighted in Green.
Hi, How do you add a key milestone date that can’t be moved. eg. Move in date?